
Chapter 4
Tissue Magnetization And Relaxation
|
|
Chapter 4 |
| Link to Book Table of Contents | Chapter Contents Shown Below |
|
Figure 4-1. The magnetization of tissue
produced by the alignment of magnetic nuclei (protons) in a magnetic
field. |
 |
Let us recall that an MR image is an image of magnetized tissue and that
the contrast we see is produced by different levels of magnetization that exist
in the different tissues at the time when “the picture is snapped.” As we will
see in this chapter the level of magnetization at specific times during the
imaging process is determined by the three tissue characteristics: proton
density (PD), T1, and T2.
We will now see how these characteristics produce image contrast.
When
tissue is placed in a magnetic field, it reaches its maximum magnetization
within a few seconds and remains at that level unless it is disturbed by a
change in the magnetic field or by pulses of RF energy applied at the resonant
frequency. The MRI procedure is a dynamic process in which tissue is cycled
through changes in its magnetization during each imaging cycle.
|
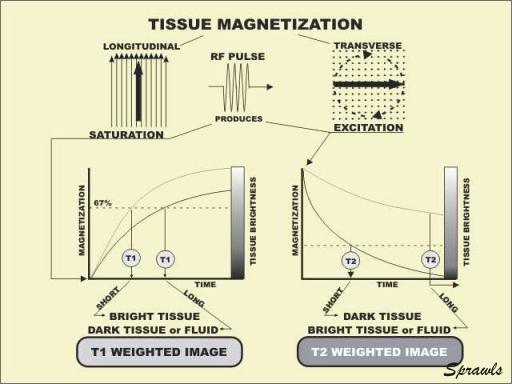
Figure 4-2. Longitudinal and transverse
magnetization. |
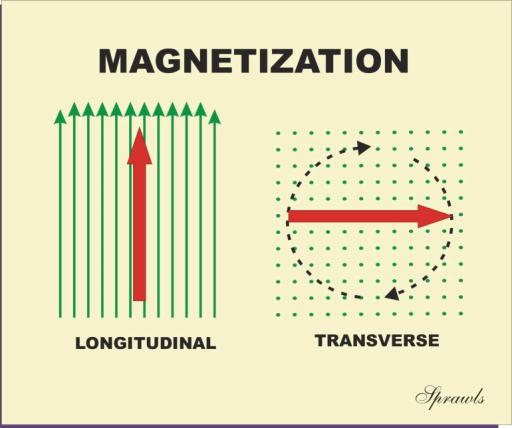 |
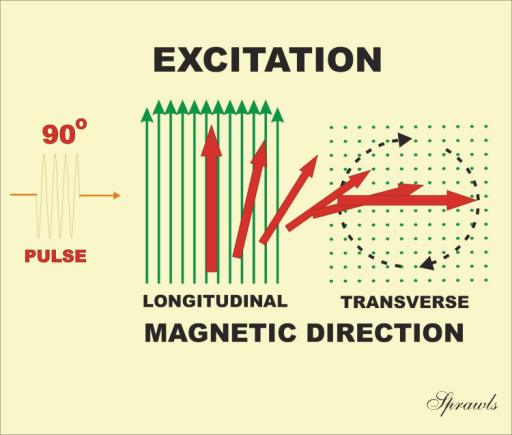
Figure 4-3. The application of a 90° RF
pulse to longitudinal magnetization produces saturation of the
longitudinal magnetization and creates transverse magnetization, an
excited condition.
The actual direction of magnetization is not limited to longitudinal or
transverse. It can exist in any direction. In principle, magnetization can have
both longitudinal and transverse components. Since the two components have
distinctly different characteristics, we consider them independently.
Longitudinal magnetization does not grow at a constant rate, but at an
exponential rate, as shown in Figure 4-4. An important concept to remember is
that the MR image is an image of magnetized tissue with brightness indicating
the level of magnetization. During the relaxation process, the level of
magnetization is changing. Therefore, the brightness of tissue (if we could see
it) is also changing as indicated by the scale on the right of the illustration.
Saturation turns the tissue dark and then it recovers brightness during the
relaxation period.
|
Figure 4-4. The growth of longitudinal
magnetization (and tissue brightness) during the relaxation process
following saturation. |
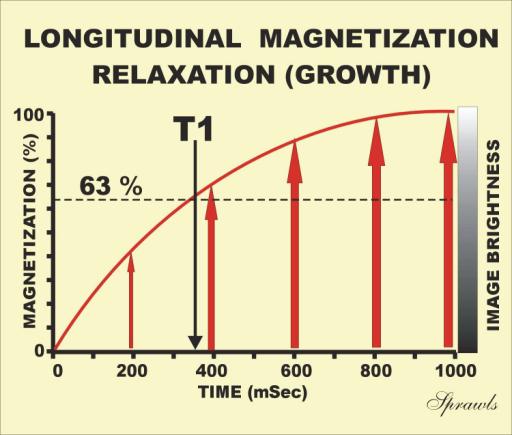 |
The characteristic that varies from one type of tissue to another, and
can be used to produce image contrast, is the time required for the
magnetization to re-grow, or the relaxation time. Because of its exponential
nature, it is difficult to determine exactly when the magnetization has reached
its maximum. The convention is to specify the relaxation time in terms of the
time required for the magnetization to reach 63% of its maximum. This time, the
longitudinal relaxation time, is designated T1. The 63% value is used
because of mathematical, rather than clinical, considerations. Longitudinal
magnetization continues to grow with time, and reaches 87% of its maximum after
two T1 intervals, and 95% after three T1 intervals. For practical purposes, the
magnetization can be considered fully recovered after approximately three times
the T1 value of the specific tissue. We will see later that this must be taken
into consideration when setting up an imaging procedure.
The time
required for a specific level of longitudinal magnetization regrowth varies from
tissue to tissue. Figure 4-5 shows the regrowth of two tissues with different T1
values. In this illustration we watch the intensity of brightness of a voxel of
tissue during the relaxation process. Let us recall that the brightness of a
tissue (RF signal intensity) is determined by the level of magnetization
existing in a voxel of tissue at any instant in time. What we see in an image
depends on when we “snap the picture” during the relaxation process. The
important thing to notice is that the tissue with the shortest T1 has the
highest level of magnetization at any particular time. The clinical significance
of this is that tissues with short T1 values will be bright in T1-weighted
images.
|
Figure 4-5. The formation of contrast
between two tissues with different T1 values. |
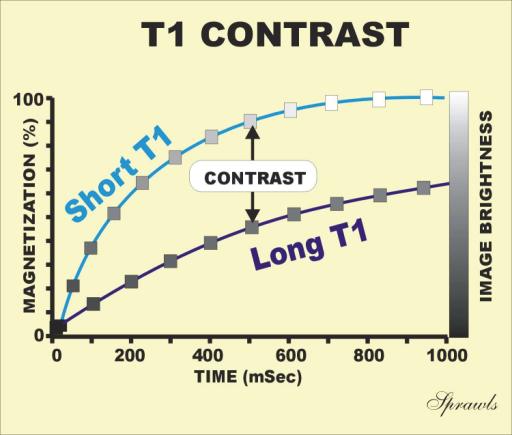 |
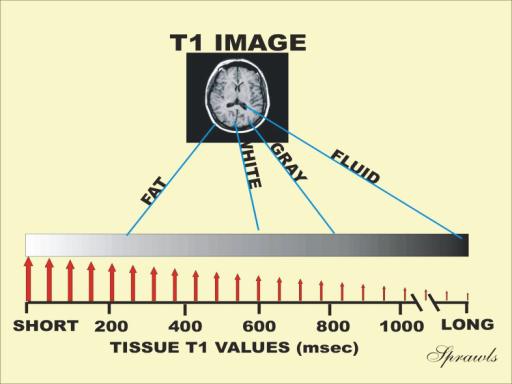
Table 4-1 lists typical T1 values for various tissues. Two materials
establish the lower and upper values for the T1 range: fat has a short T1, and
fluid falls at the other extreme (long T1). Therefore, in T1-weighted images,
fat is generally bright, and fluid [cerebrospinal fluid (CSF), cyst, etc.] is
dark. Most other body tissues are within the range between fat and fluid.
The longitudinal relaxation process involves an interaction between the
protons and their immediate molecular environment. The rate of relaxation (T1
value) is related to the naturally occurring molecular motion. The molecular
motion is determined by the physical state of the material and the size of the
molecules. The relatively rigid structure of solids does not provide an
environment for rapid relaxation, which results in long T1 values. Molecular
motion in fluids, and fluid-like substances, is more inducible to the relaxation
process. In this environment molecular size becomes an important characteristic.
Relaxation is enhanced by a general matching of the proton resonant
frequency and the frequency associated with the molecular motions. Therefore,
factors that change either of these two frequencies will generally have an
effect on T1 values
|
|
T2
(msec) |
T1 (0.5 T)
(msec) |
T1 (1.5 T)
(msec) |
|
Adipose (Fat)
Liver
Muscle
White Matter
Gray Matter
CSF |
80
42
45
90
100
100 |
210
350
550
500
650
1800 |
260
500
870
780
920
2400 |
Tissues generally contain a combination of water and a variety of larger
molecules. Some of the water can be in a relatively free state while other water
is bound to some of the larger molecules. In general, the T1 value of the tissue
is probably affected by the exchange of water between the free and the bound
states. When the water is bound to larger molecular structures, it takes on the
motion characteristics of the larger molecule. Factors such as a pathologic
process, which alters the water composition of tissue, will generally alter the
T1 values.
Let us now combine two factors to create a T1 image as illustrated in
Figure 4-6. One factor is that different tissues have different T1 values and
rates of regrowth of longitudinal magnetization. This then causes the different
tissues to be at different levels of magnetization (brightness) when the picture
is snapped during the relaxation period. Here we see the order of tissue
brightness is inversely related to T1 values. In principle, the tissues with
short T1 values get brighter faster and are at a higher level when the picture
is snapped.
|
Figure 4-6. A T1 image showing the
relationship of tissue brightness (signal intensity) to T1 values and
level of magnetization during the longitudinal relaxation process. |
 |
Transverse magnetization is used during the image formation process for
two reasons: (1) to develop image contrast based on differences in T2 values;
and (2) to generate the RF signals emitted by the tissue. Longitudinal
magnetization is an RF silent condition and does not produce any signal.
However, transverse magnetization is a spinning magnetic condition within each
tissue voxel, and that generates an RF signal. As we will see in the next
chapter, each imaging cycle must conclude with transverse magnetization to
produce the RF signal used to form the image.
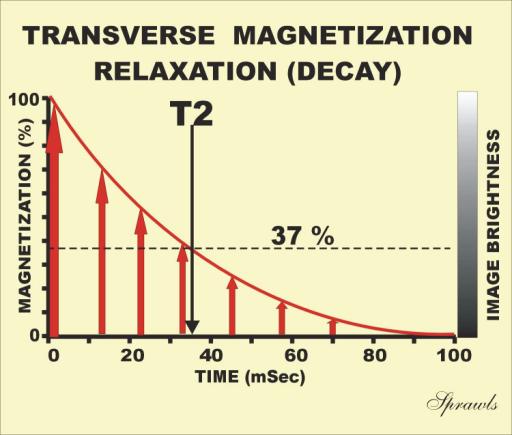
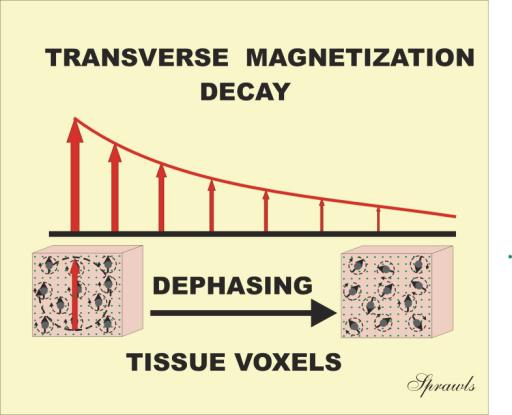
The characteristics of transverse magnetization and relaxation are quite
different from those for the longitudinal direction. A major difference is that
transverse magnetization is an unstable condition and the relaxation process
results in the decay, or decrease, in magnetization, as shown in Figure 4-7. The
T2 value is the time required for 63% of the initial magnetization to dissipate.
After one T2, 37% of the initial magnetization is present.
|
Figure 4-7. The decay of transverse
magnetization during the relaxation process and the associated tissue
brightness. |
 |
|
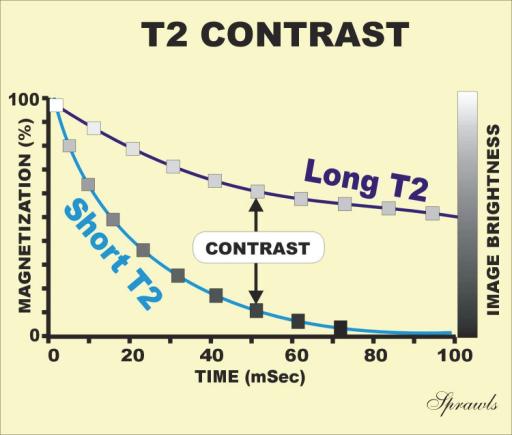
Figure 4-8. The formation of T2 contrast
during the decay of transverse magnetization. |
 |
What we will actually see in a T2-weighted image, as shown in Figure 4-9,
depends on the level of magnetization at the time when we snap the picture. The
important thing to observe here is that the tissues with long T2 values
are bright in T2 images.
|
Figure 4-9. A T2 image showing the
relationship of tissue brightness |
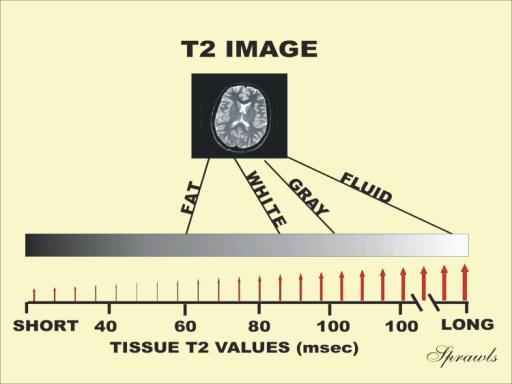 |
In general, a T2-weighted image appears to be a reversal of a T1-weighted
image. Tissues that are bright in one image are dark in the other image. This is
because of a combination of two factors. One factor is that T1 and T2 values are
generally related. Even though T2 values are much shorter than T1 values, as
shown in Table 4-1, they are somewhat proportional. Tissues with long T1 values
usually have long T2 values. The other factor is that the order of brightness in
a T2 image is in the same direction as the T2 values. Remember, it was a
reversed relationship for T1 images.
The decay of transverse magnetization (i.e., relaxation) occurs because
of a dephasing among individual nuclei (protons) within the individual voxels,
as shown in Figure 4-10.
|
Figure 4-10. The dephasing of protons
that produces |
 |
Two basic conditions are required for transverse magnetization: (1) the
magnetic moments of the nuclei must be oriented in the transverse direction, or
plane; and (2) a majority of the magnetic moments must be in the same direction,
or in phase, within the transverse plane. When a nucleus has a transverse
orientation, it is actually spinning around an axis that is parallel to the
magnetic field.
After the application of a 90˚ pulse, the nuclei have a transverse
orientation and are rotating together, or in phase, around the magnetic field
axis. This rotation or spin is a result of the normal precession discussed
earlier. The precession rate, or resonant frequency, depends on the strength of
the magnetic field where the nuclei are located. Nuclei located in field areas
with different strengths spin (precess) at different rates. Even within a very
small volume of tissue, nuclei are in slightly different magnetic field
strengths. As a result, some nuclei spin faster than others. Also, there are
interactions (spin-spin interactions) among the spinning nuclei. After a short
period of time, the nuclei are not spinning in phase. As the directions of the
nuclei begin to spread and they dephase, the magnetization of the tissue
decreases. A short time later, the nuclei are randomly oriented in the
transverse plane, and there is no transverse magnetization.
|
Figure 4-11. Comparison of relaxation
produced by the T2 characteristics of tissue and the T2* effects
associated with magnetic field inhomogeneities. |
 |
Many materials are susceptible to magnetic fields and become
magnetized when located in fields. The susceptibility of a material is
determined by the orbital electrons in the atom rather than the magnetic
properties of the nucleus. Significant susceptibility is present only when there
are unpaired electrons in the outer orbit.
There are three general types of materials with respect to magnetic
susceptibility: diamagnetic, paramagnetic, and ferromagnetic. The
primary characteristic of each type is the amount and direction of magnetization
that the material develops when placed in a magnetic field. There are situations
when each type plays a role in the MR imaging process.
Paramagnetic substances include metal ions such as gadolinium, manganese,
iron, and chromium. Other substances such as nitroxide free radicals and
molecular oxygen also have paramagnetic properties.
Gadolinium has seven unpaired electrons in its orbit, which give it a
very strong magnetic property. It must be chelated to reduce its toxicity. An
example is gadolinium chelated to diethylene triamine penta-acetic acid (GaDTPA).
When a paramagnetic substance, such as gadolinium, enters an aqueous
solution, it affects the relaxation rate of the existing protons. It does not
produce a signal itself. In relatively low concentrations, the primary effect is
to increase the rate of longitudinal relaxation and shorten the value of T1. In
principle, the fluctuating magnetic field from the individual paramagnetic
molecules enhances the relaxation rate. The primary result is an increase in
signal intensity with T1-weighted images. It is classified as a positive
contrast agent.
Signal intensity will generally increase with the concentration of the
paramagnetic agents until a maximum intensity is reached. This intensity is very
dependent on the imaging parameters. Higher concentrations will generally
produce a reduction of signal intensity. This occurs because the transverse
relaxation rate is also increased, which results in a shortening of the T2
value.
The particles produce inhomogeneities in the magnetic field, which
results in rapid de-phasing of the protons in the transverse plane and a
shortening of T2.
Superparamagnetic materials in the form of large particles generally
reduce signal intensity and are classified as negative contrast agents. When in
the form of very small particles, they reduce T1 and increase signal intensity.
Ferromagnetic is the name applied to iron and only a few other materials that
have magnetic properties like iron. These materials have a very high
susceptibility and develop a high level of magnetism when placed in a magnetic
field.
Tissue Magnetization And Relaxation
When tissue containing magnetic nuclei, i.e., protons, is placed in a
strong magnetic field, the tissue becomes magnetized. It is initially magnetized
in the longitudinal direction. However, by applying a pulse of RF energy the
magnetization can be flipped into the transverse plane. Both longitudinal and
transverse magnetization have characteristics that can be used to develop image
contrast. An imaging procedure can be adjusted to display the different types of
contrasts.
When a 90° RF pulse is applied to longitudinal magnetization, it produces
two effects. First, it temporarily destroys the longitudinal magnetization, a
condition known as saturation. It also produces transverse magnetization,
a condition known as excitation because transverse magnetization is an
unstable excited state.
After a saturation pulse is applied, the longitudinal magnetization will
recover or regrow, a process known as relaxation. The rate of regrowth is
a characteristic of each specific tissue and is described by its T1 value, the
longitudinal relaxation time. A tissue with a short T1 will recover its
magnetization fast and will appear bright in a T1-weighted image. Tissues with
longer T1 values will recover magnetization somewhat slower and will be
relatively dark in T1-weighted images.
Following the production of transverse magnetization by the RF pulse the
magnetization begins to decay or relax. The rate of relaxation is a
characteristic of each specific tissue and is expressed by the T2 values, the
transverse relaxation time. A tissue with a short T2 will lose its transverse
magnetization rapidly and will appear relatively dark in T2-weighted images.
Tissues and body fluids with long T2 values will retain their transverse
magnetization longer and will appear bright in T2-weighted images.